User interface reference
Reference for every tab and control in the EagleEye web UI, served at
http://<device-address>:5001. For step-by-step setup, start at
Start Here.
The large panel on the left holds the current tool. Six tabs stay in the navigation on the right:
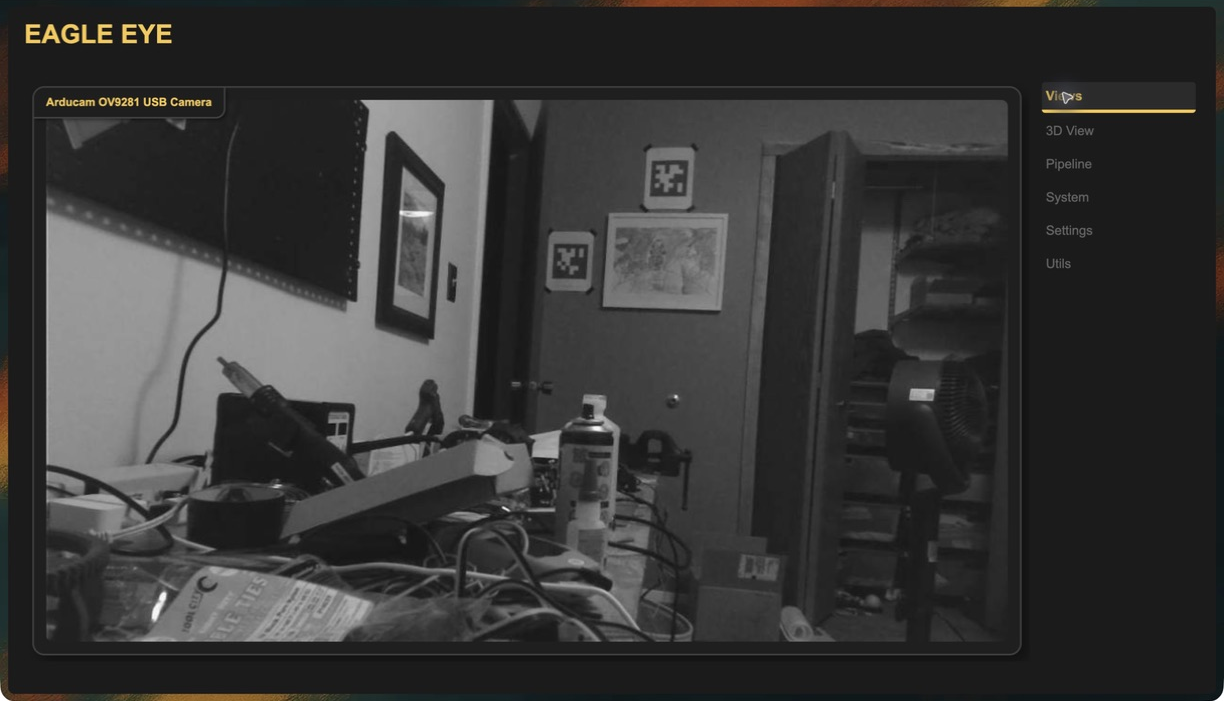
| Tab | Purpose |
|---|---|
| Views | Live camera thumbnails |
| 3D View | Field and robot pose visualization |
| Pipeline | Build and edit pipelines |
| System | CPU, memory, storage, pipeline states |
| Settings | Backend configuration, logs, terminal, system tools |
| Utils | Camera calibration and extrinsics |
A fresh installation opens the camera setup wizard, starting with a camera preview and placement-name grid. After setup, use Views for live video, Pipeline for the graph, and System to check that pipelines are running. Settings includes camera renaming and device controls. Utils holds calibration and mounting values.
Views
Live stream of every detected camera, one card each, labelled with the camera name. This is the raw camera feed, not pipeline output. Use it for aiming, focus, and exposure.
If no cameras were detected, the tab shows a message instead of cards. See Check Your Cameras.
The image quality streamed here is controlled by view stream downscale in Settings and does not affect what pipelines process.
3D View
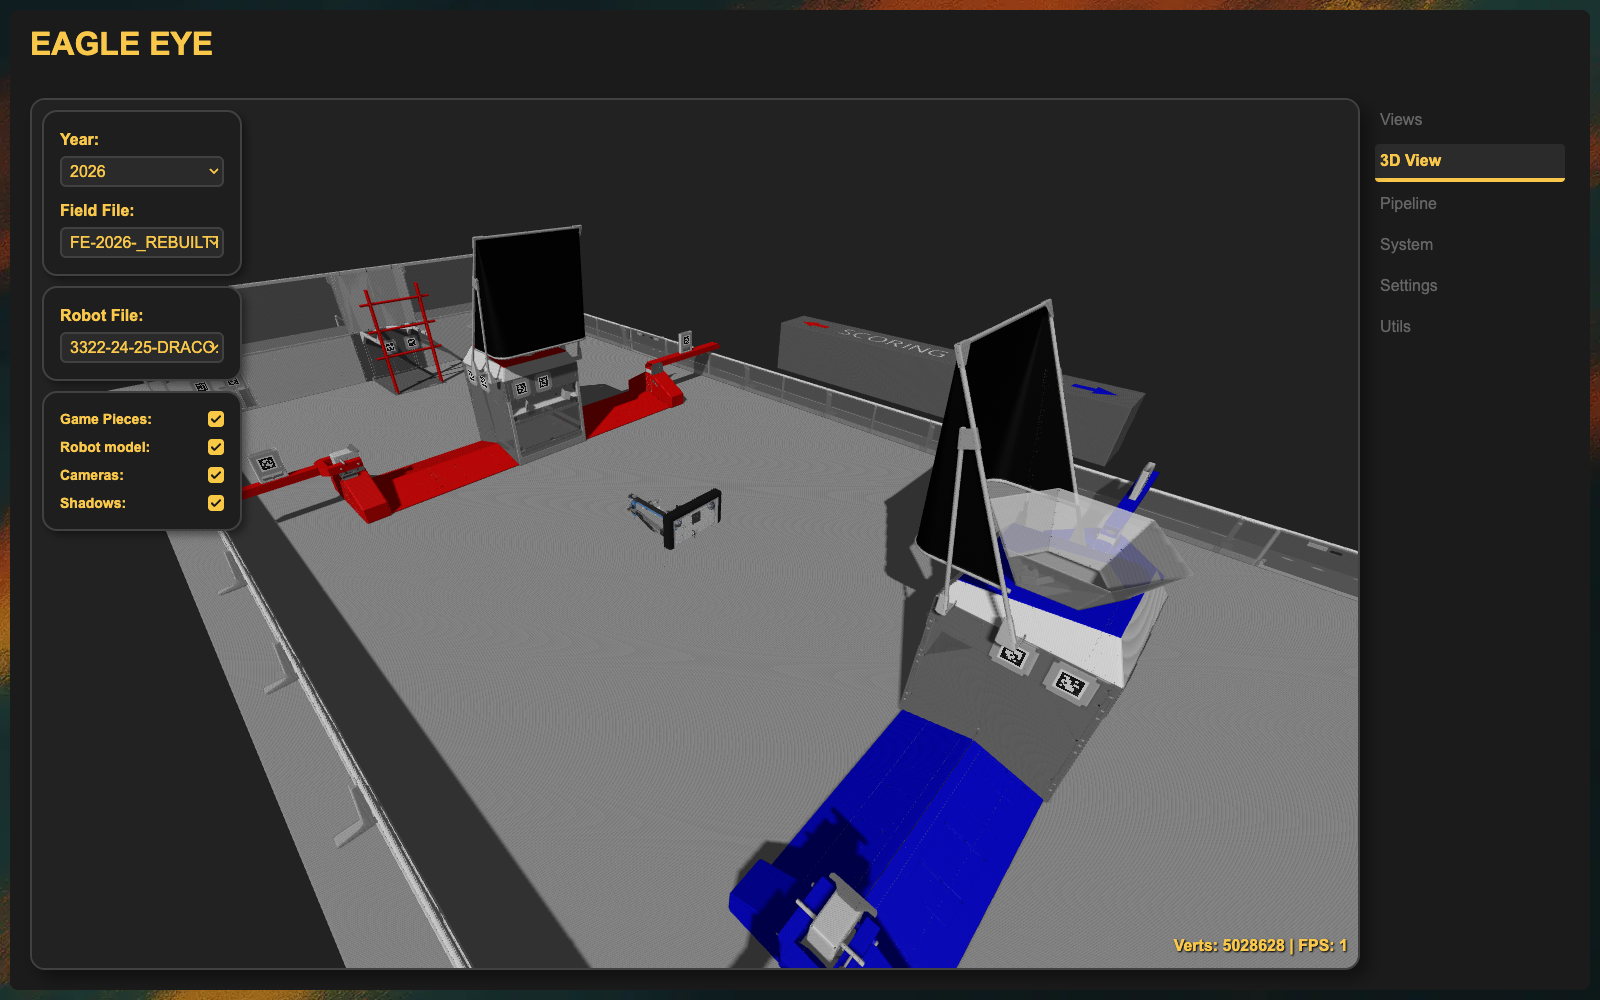
A 3D field scene with the robot drawn at the latest pose from Robot Pose Output nodes.
Controls
| Input | Action |
|---|---|
| Left-click drag | Rotate |
| Scroll | Zoom |
| Right-click drag | Pan |
Options
| Control | Description |
|---|---|
| Year | Which season's field assets to load |
| Field File | Which field mesh to use; simplified meshes render faster |
| Robot File | Robot model shown at the estimated pose |
| Game Pieces | Show or hide game piece objects |
| Robot Model | Show or hide the robot model |
| Cameras | Show or hide camera markers on the robot |
| Shadows | Shadow rendering; turn off to reduce load |
A loading overlay with a progress bar appears while assets download. A stats readout in the corner shows scene statistics and frame rate.
3D assets are managed from Settings → Robot and Field Files → Manage. The manager uploads and deletes robot .glb files, field .glb files, and matching field maps. After upload, select the asset from the 3D View dropdown instead of entering a project path.
Pipeline
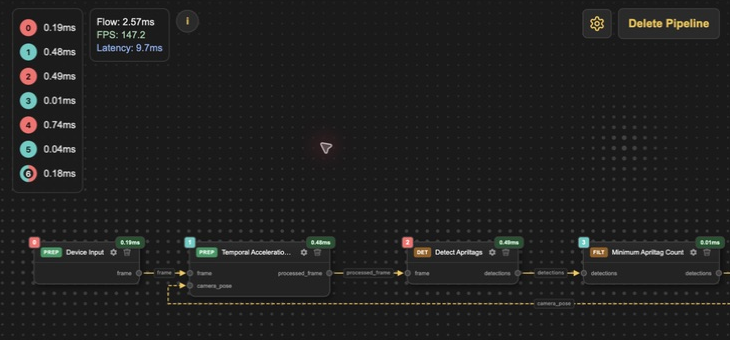
The pipeline editor.
Layout
- Canvas: nodes and connections.
- Operations list: drag operations onto the canvas.
- Operation settings: opens when you click a node.
- Pipeline dropdown: switch pipelines; New Pipeline creates one from a blank graph or bundled template.
Working with the graph
| Action | How |
|---|---|
| Add a node | Drag from the Operations list onto the canvas |
| Connect nodes | Drag from an output port to an input port |
| Edit a node | Click it and use the settings panel |
| Fit the graph in view | Double-click empty canvas |
| Edit a connection | Right-click it |
| Mark a feedback edge | Right-click → Set as Default Connection (draws dashed) |
| Unmark it | Right-click → Remove Default Status |
If the context menu reads Cannot Set Default, that target port does not accept a default connection.
When creating a pipeline, choose Basic localization, AprilTag localization, Object detection (CPU), or Object detection (MX3) to start from a wired graph. EagleEye generates fresh node IDs for every copy.
File parameters have a dropdown and Manage control. Use Manage → Upload File, close the manager, and select the uploaded file. This is the normal workflow for field maps, models, and other operation assets; raw {project_root} paths are for development and imported legacy configurations.
Edits save as you make them. Changing node positions or ordinary tuning values does not stop the running backend. When an operation supports live configuration, clicking Done applies the new values to that operation immediately.
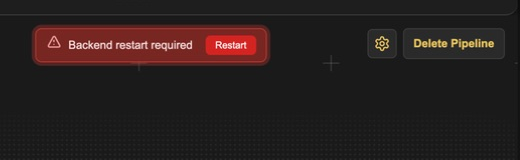
Some fields build resources that cannot be replaced safely while the operation is running. Camera selection, model selection, and map selection are common examples. These fields show a restart note in the settings panel. Graph structure changes also require the backend to rebuild the pipeline. After you save one of these changes, a red Backend restart required banner appears above the canvas. Click Restart there when you are ready to interrupt processing and load the saved configuration.
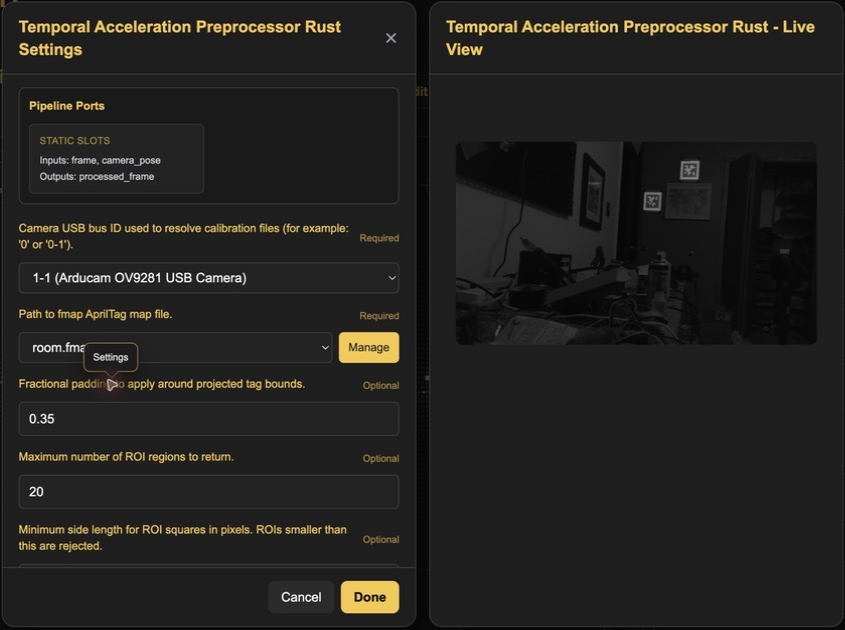
Operation settings can also include a live view. Open the node's gear button to tune it beside the image it produces. This is useful for detection, filtering, and preprocessing operations.
Profiling panels
The canvas overlays two small profiling panels. The left panel lists each execution timestep and its operation time. The summary shows:
| Value | Meaning |
|---|---|
| Flow | Time spent running the operation graph for the current frame |
| FPS | Estimated completed pipeline cycles per second, including the wait for a fresh input frame |
| Latency | Age of the camera frame when processing finished, including capture, transfer, decode, and pipeline work |
Both panels read "No profiling data" until frames flow.
Timestep numbers and thread colors
Each node has a colored square at its upper-left corner:
- The number is the zero-based execution timestep. It is not a thread number.
- The color identifies the worker thread. Thread 1 is red, Thread 2 is teal, and later threads use blue, light green, yellow, gray, pink, purple, green, and orange. The palette repeats if a pipeline needs more than ten threads.
- Nodes with the same number belong to the same timestep. They can run at the same time when the scheduler assigns them different thread colors.
- A thread can run several nodes across different timesteps. The color follows the thread, not the operation type.
The PREP, DET, FILT, PROC, and NET chips inside the node header describe the operation category. Their colors are unrelated to worker threads. The green badge at the upper-right of a running node is that operation's measured time for the latest frame.
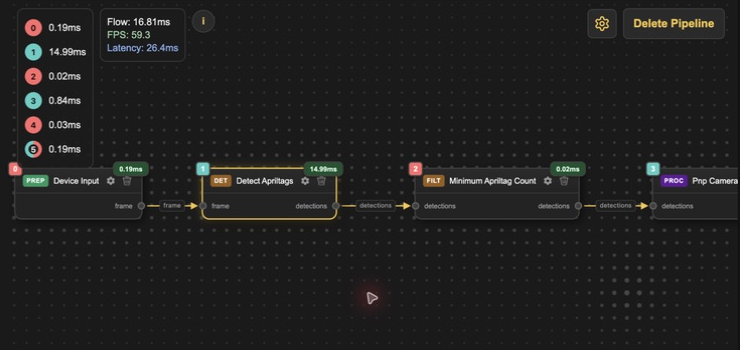
The compact timestep list uses the same colors. If several threads participate in one timestep, its circle is split into equal colored segments.
Profiling details
Click the i button to open Profiling details. The top section records frame wall time,
full cycle time, capture latency, and the frame sequence. By timestep compares the wall
time around a group with Σ ops, the sum of its individual operation times. When operations
run in parallel, Σ ops can be larger than wall time.
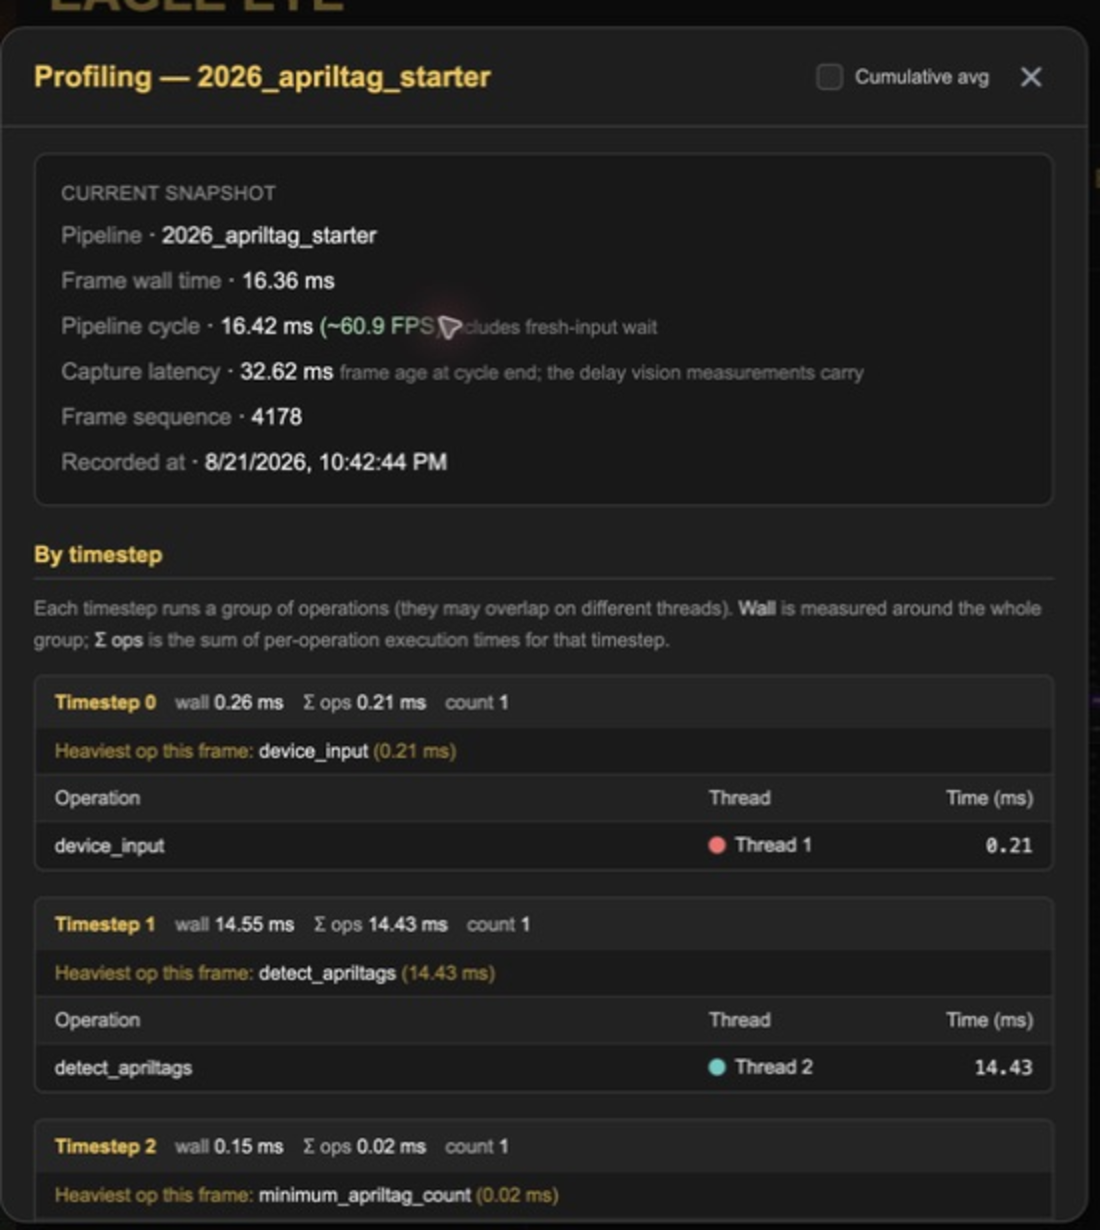
Scroll to By thread to see which operations the scheduler assigned to each worker. Thread numbers start at 1. The scheduler chooses the minimum number of workers needed for operations that overlap, then reuses those workers in later timesteps.
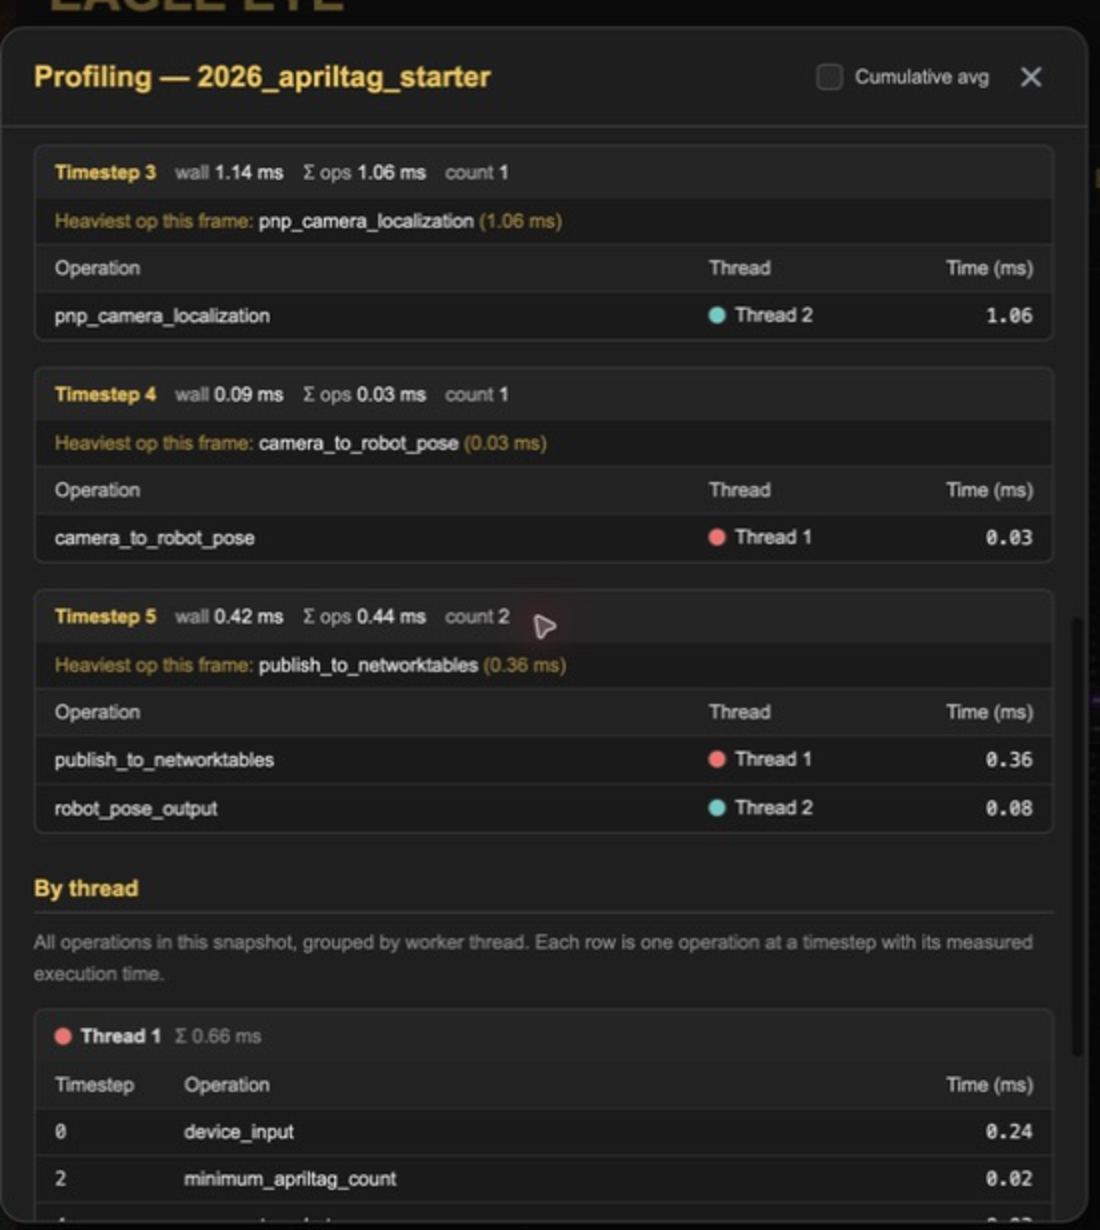
Enable Cumulative avg to replace the newest-frame numbers with the arithmetic mean of all profiling updates received since you enabled it. It is not a rolling window. Turn it off and back on to start a new average.
Operations
Every operation available in the editor, grouped by what it does.
Input
| Operation | Description |
|---|---|
| Device Input | Reads frames from a camera by camera_bus_id. Optional frame_rotation in 90° steps. First node in any camera pipeline |
| Get NetworkTables Value | Reads a NetworkTables key and injects the value into the pipeline |
Detection
| Operation | Description |
|---|---|
| Detect AprilTags | AprilTag detection. Settings: families, nthreads, quad_decimate, quad_sigma, refine_edges, decode_sharpening |
| Color Threshold Detection | Finds regions matching an HSV colour range |
| Most Dense Color Threshold Detection | As above, returning only the densest region |
| Object Detection | Runs a neural network model to detect objects by class |
| MX3 Async Object Detection | Object detection on an MX3 accelerator, run asynchronously |
Preprocessing
| Operation | Description |
|---|---|
| Temporal Acceleration Preprocessor Rust | Predicts where tags will be from the previous camera pose and passes only those regions to the detector. Needs a default-marked camera_pose feedback edge. See Add Temporal Acceleration |
Filtering
| Operation | Description |
|---|---|
| Minimum AprilTag Count | Stops the pipeline for this frame unless at least minimum_detections tags were found |
| Tag Filter | Whitelist or blacklist tag IDs (filter_mode, tag_ids) |
| Pose Outlier Filter Rust | Rejects poses that disagree with recent history using predictive gating |
Pose
| Operation | Description |
|---|---|
| PnP Camera Localization | Camera pose on the field from tag detections, intrinsics, and the tag map |
| Camera To Robot Pose | Applies the camera's saved extrinsics to turn a camera pose into a robot pose |
| Camera Local To Robot Transform | Converts camera-relative detection positions into robot-relative positions |
| Robot Local To Field Transform | Converts robot-relative coordinates into field coordinates |
| Camera Adjust | Applies an offset correction to a camera pose |
| Pose Fusion | Combines multiple pose estimates |
| Flatten Pose | Reduces a 3D pose to 2D |
| Extract Pose | Pulls a specific pose out of a combined value |
| Ground Plane Intersection | Projects a detection onto the field floor to estimate its 3D position |
| Angle To Objects | Bearing angles from the camera to detected objects |
Output
| Operation | Description |
|---|---|
| Publish To NetworkTables | The only operation that writes to NetworkTables. Settings: target_key, schema, data_path |
| Robot Pose Output | Sends the robot pose to the 3D View. Passes the pose through. Does not publish to NetworkTables |
| Camera Pose Output | Sends a camera pose to the 3D View for the given camera_bus_id |
| Detected Objects Output | Sends detected object positions to the UI |
System
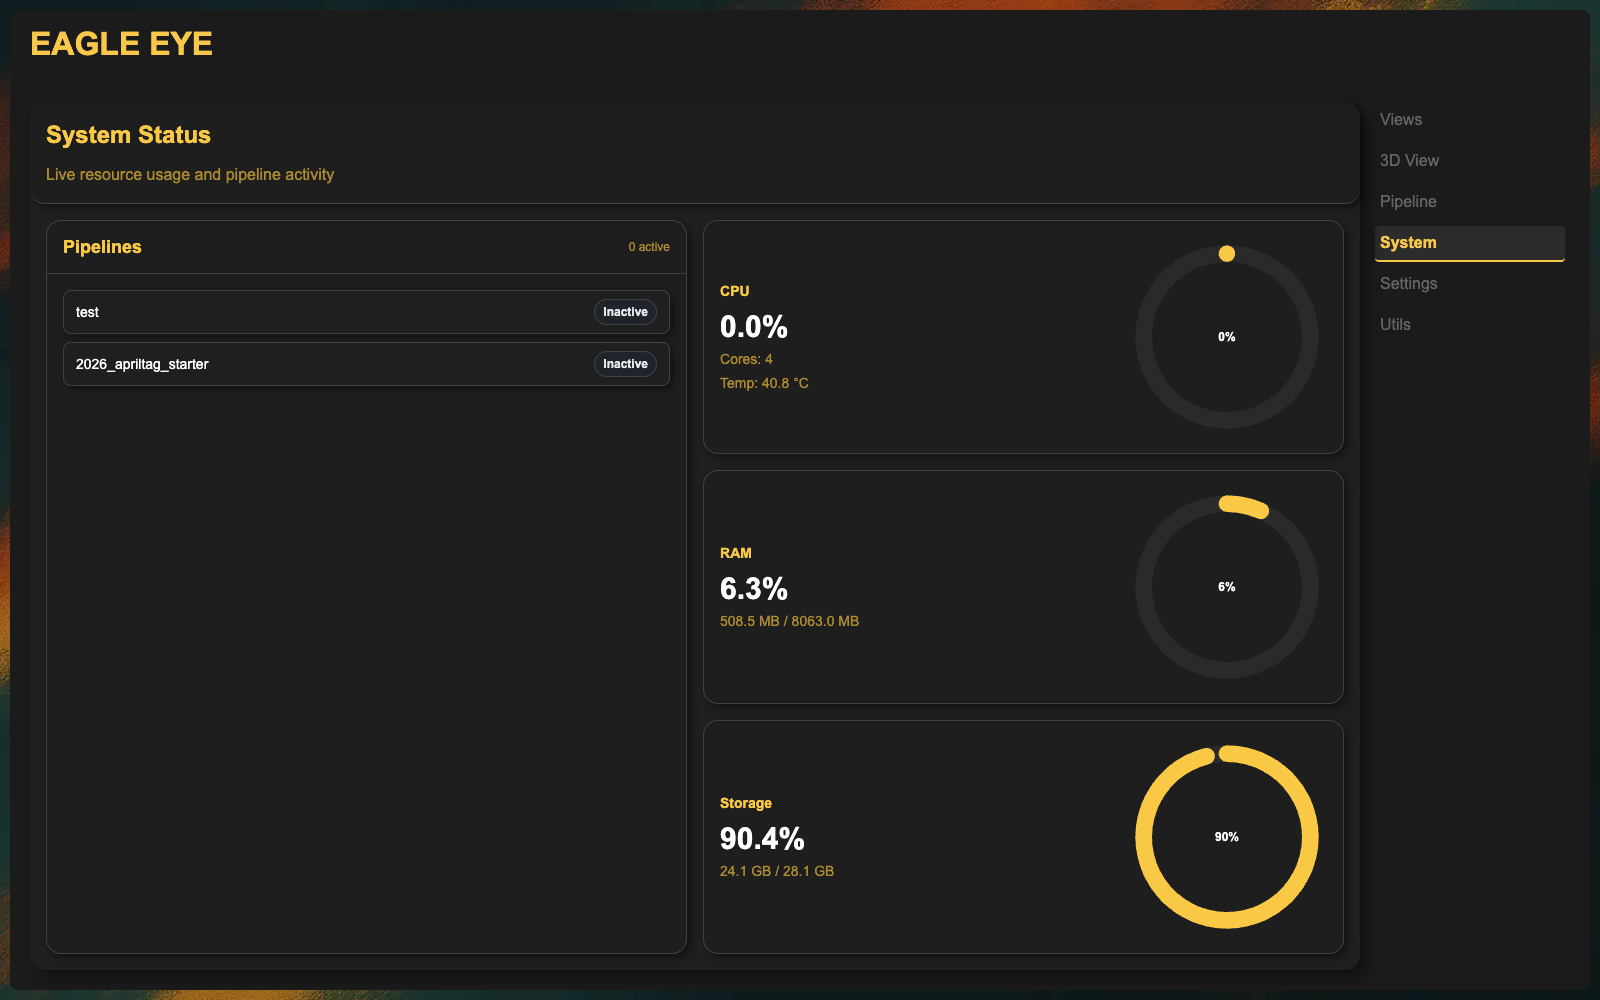
Live hardware and pipeline status, updated continuously by the backend.
| Panel | Shows |
|---|---|
| Pipelines | Every configured pipeline and whether it is running |
| CPU | Usage percentage, per-core detail, temperature |
| RAM | Usage percentage and amounts |
| Storage | Usage percentage and amounts |
If the numbers stop moving, the UI has lost its connection to the backend. Reload the page, then check the service.
Settings
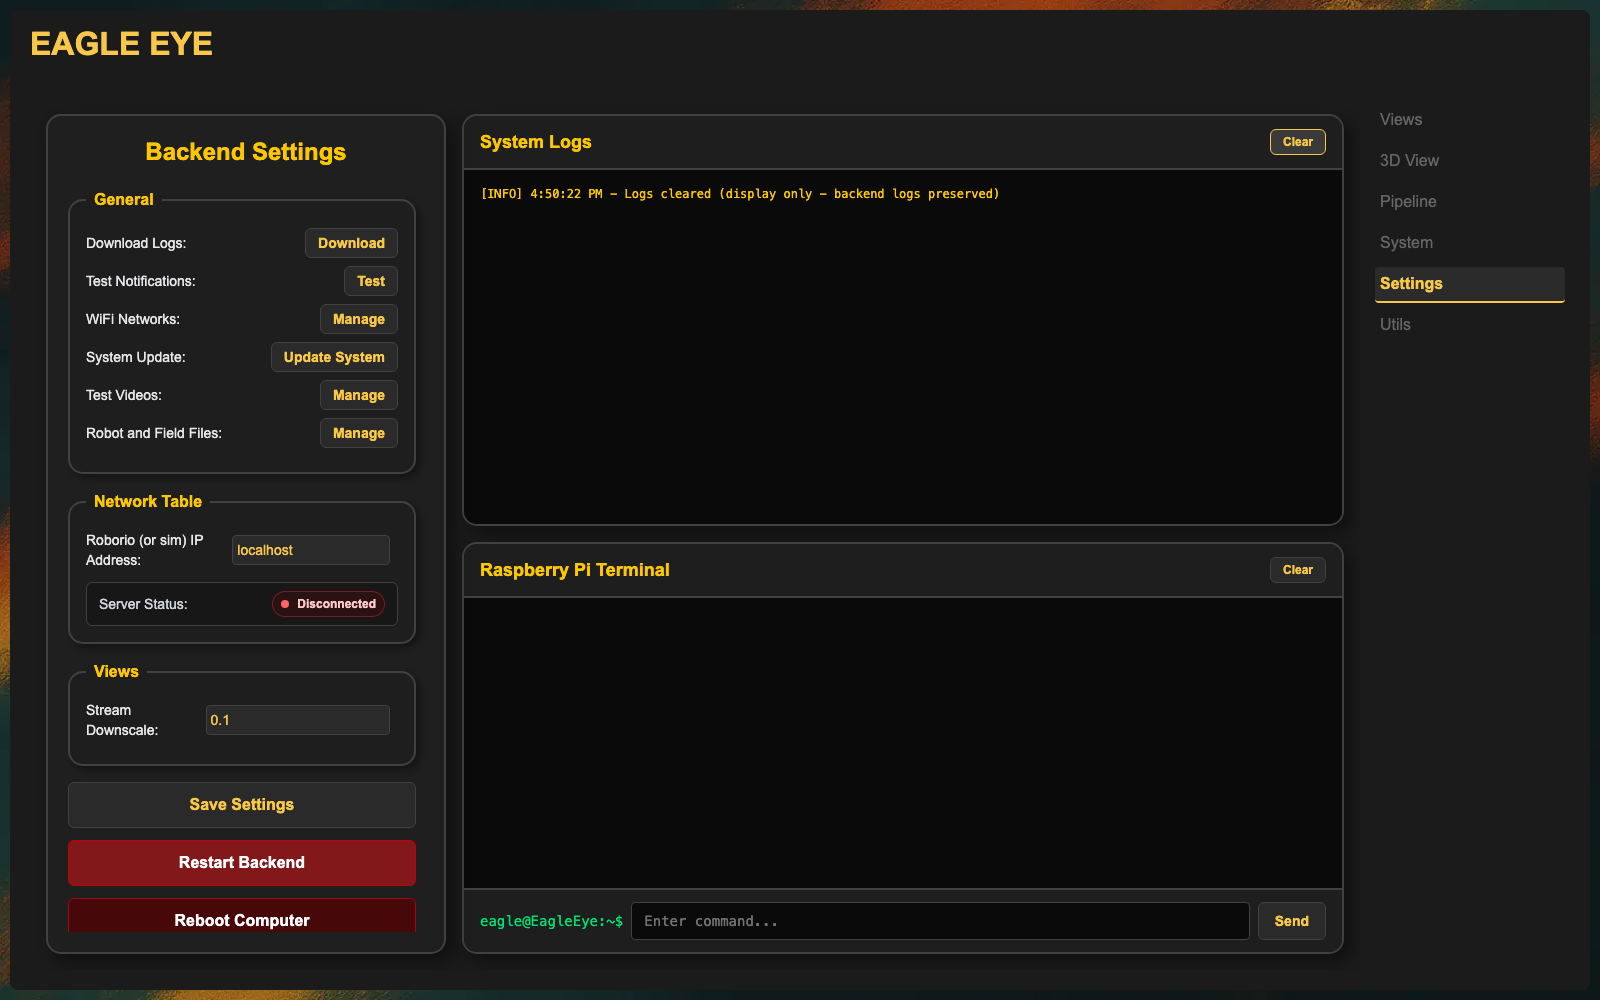
General
| Control | Description |
|---|---|
| Camera setup wizard → Open | Reopens the guided camera naming, calibration, mounting, and pipeline setup flow |
| Download Logs | Saves the backend log file to your computer |
| Test Notifications | Sends a test notification |
| Manage Networks | Wireless network configuration for the device |
| Update System | Runs the system/software update flow |
| Manage Test Videos | Manage recorded video files usable as camera sources for offline testing |
| Robot and Field Files → Manage | Manage field and robot models used by the 3D View |
Connect Wi-Fi
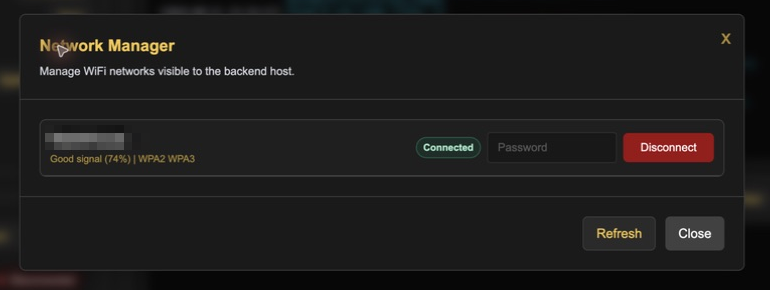
Click Manage next to WiFi Networks. Enter a password beside the network, then click Connect. The connected row shows a green status label and a Disconnect button.
Camera Names
The preview grid lists active cameras. Enter a Placement description and click Save name on its card. Names persist across reboots without changing camera bus IDs, calibration, feed URLs, or robot-code subscription keys. Refresh previews takes new snapshots; these are not live streams. See Rename a camera later.
Network Table
| Control | Description |
|---|---|
| Roborio (or sim) IP Address | roboRIO or simulation host address. A fresh install uses localhost; replace it. See Connect NetworkTables |
| Status indicator | Current NetworkTables connection state; reads Unknown before the first connection |
Views
| Control | Description |
|---|---|
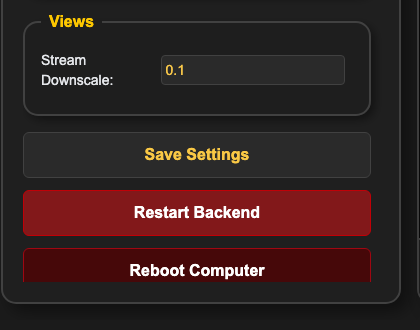
| View stream downscale | Shrinks live Views streams before sending them to the browser. Lower values reduce bandwidth and CPU. It does not change pipeline inputs or the small naming-grid snapshots |
Actions
| Control | Description |
|---|---|
| Save Settings | Persists the NetworkTables address and view stream downscale; camera descriptions have their own Save name buttons |
| Restart Backend | Restarts the EagleEye backend process |
| Reboot Computer | Reboots the whole device |
System Logs
Live backend log output, with a Clear button that clears the display.
Terminal
A terminal panel for running shell commands on the device without a separate SSH session: prompt, command input, Send, output area, and a clear button.
The terminal's behaviour was not exercised while writing this guide. If it does not respond, use SSH.
Utils
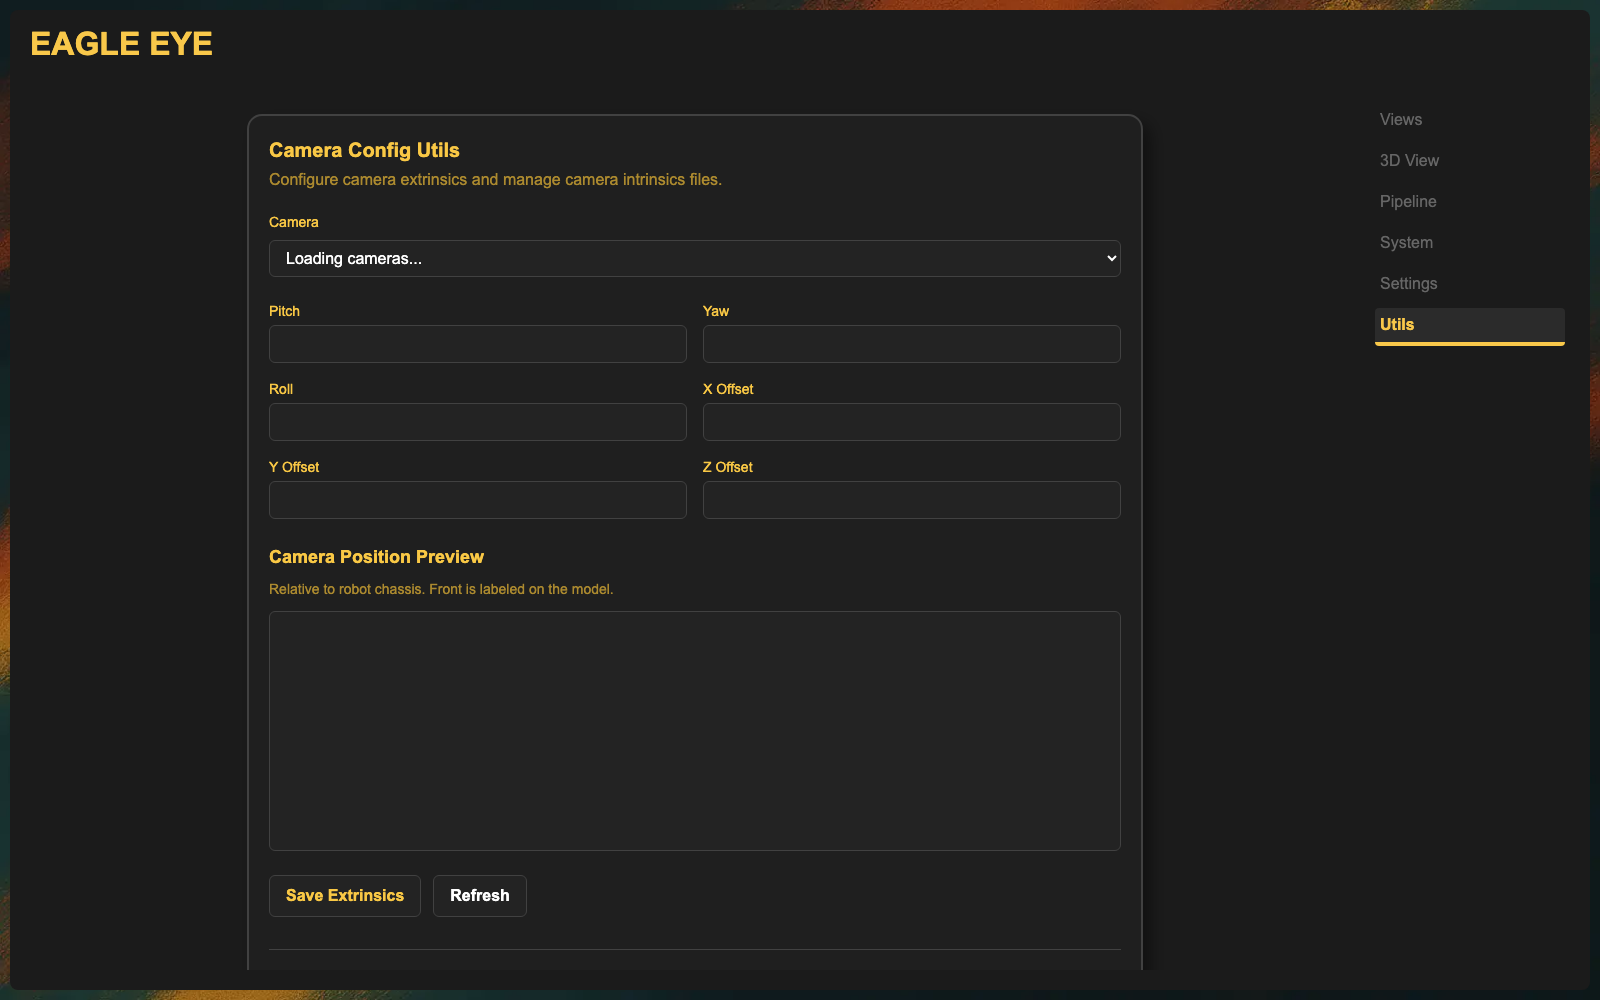
Per-camera configuration. Select the camera in the Camera dropdown first. Everything on this tab applies to the selected camera.
Extrinsics
Fields: Pitch, Yaw, Roll (degrees) and X Offset, Y Offset, Z Offset (meters). Save Extrinsics persists them; Refresh reloads stored values, discarding unsaved edits.
The Camera Position Preview draws the camera on a robot model so you can sanity-check the numbers. See Configure Extrinsics.
Intrinsics
| Control | Description |
|---|---|
| Status line | Whether the selected camera has an intrinsics file |
| Upload Intrinsics | Upload a .json calibration, or drop a file on the dropzone |
| Calibrate Camera | Opens the built-in ChArUco calibration tool |
| View Distortion | Side-by-side raw and undistorted feeds for checking a calibration |
| Delete Current Intrinsics | Removes the selected camera's calibration |
Calibration tool
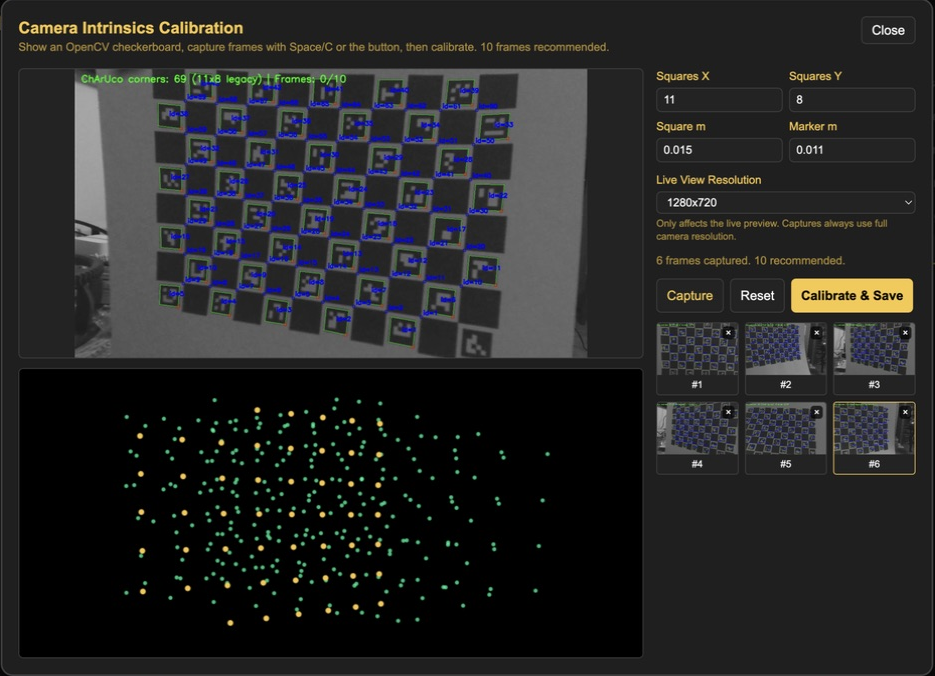
Live feed with detected corners, board settings (Squares X, Squares Y, Square m, Marker m), a preview-resolution selector, Capture, Reset, and Calibrate & Save buttons, saved-frame thumbnails, and a corner-coverage plot. Walkthrough: Calibrate Intrinsics.
Verified against EagleEye-Vision-System main at commit c73a871 (2026-08-20). The operations
list above is taken from the operation definitions in the source tree at that commit; a
running install may show additional custom operations you have added.